San Francisco & San Jose rental management indicators continue to show strong growth in all sectors

San Francisco Bay Area Property Manager — Do It Yourself!
Download your free real estate investment template today
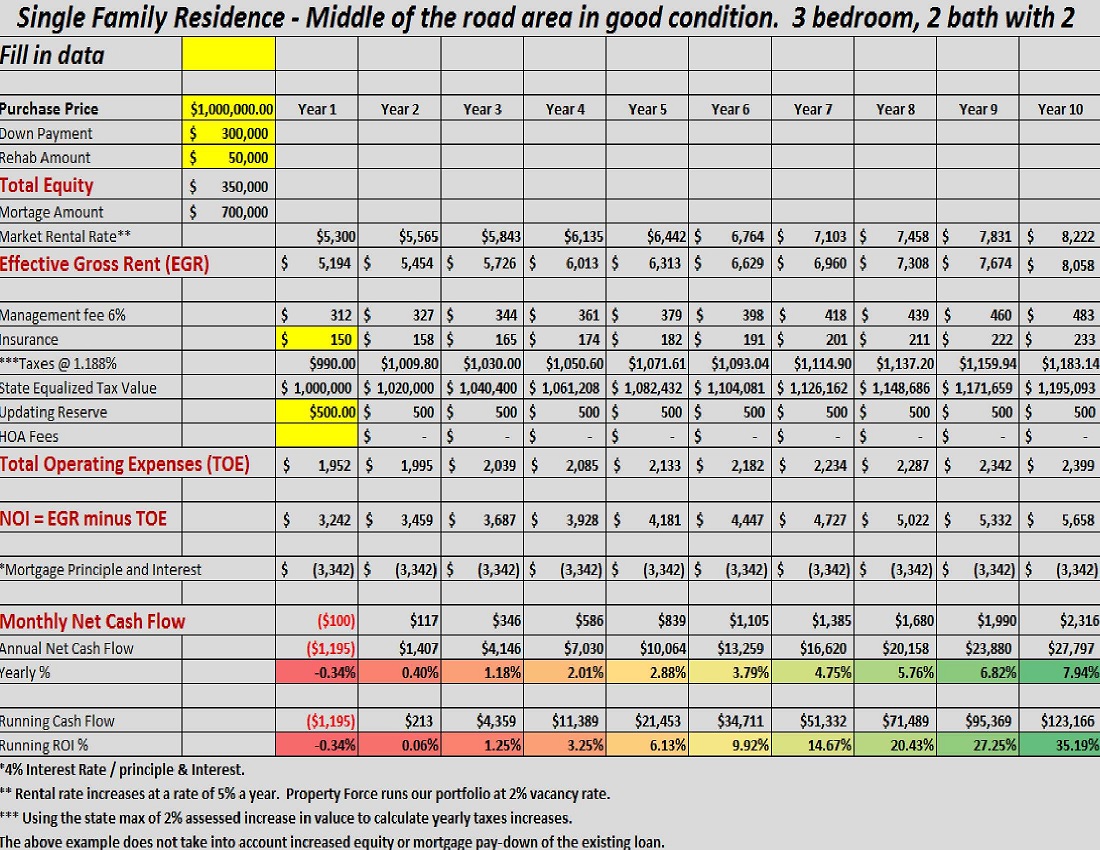
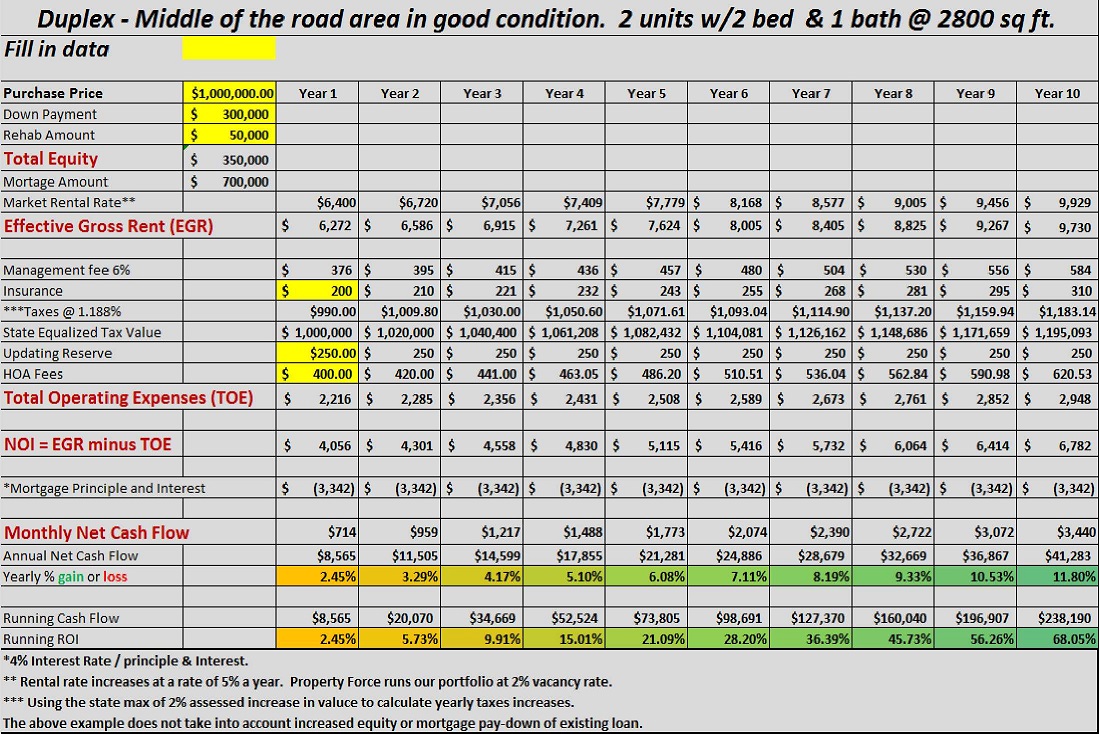
In the previous blog we talked about specific market indicators and how one goes about finding and understanding those indicators. Now that you understand how to read the indicators its time to put all your numbers into the attached worksheet to compare oranges to oranges or apples to oranges as they say.
The two below spread sheets are examples of the process used to determine carrying costs. Feel free to download the link below and plug in your own market numbers in the YELLOW cells to analyze how your properties are currently preforming. The results may convince you to actually sell a property moving your investment dollars to a more secure cash flow positive property. With the tax advantage of a 1031 exchange moving your tax dollars without the immediate tax penalty of a sale is a great way to stay nimble. Both individuals and investment groups use the 1031 exchange tax rule to buy and sell properties maximizing returns without the penalty of taxes similar to an IRA with an investment banker where there is a final or partial sales to cash out the investment.
With the San Francisco Bay Area having some of the highest real estate prices and rental rates in the nation it is more crucial than most to manage your investment dollars. Wrong decisions can lead to potentially thousands of dollars lost, while educated decisions lead to monthly gains when combining equity increases, rental income and the fees of carrying costs. A good rule to follow is to determine the amount of leverage you need to withstand any down markets. Making $$$$ in the short terms is always a potential but making it in the long term has consistently been a guarantee.
In the final part of this series we will discuss how to go about combining the indicators and investment property worksheet to develop a real estate portfolio that fits your goals!!!!!

1 purchase left $115,024 on the table

Investment Property Worksheet Download
A couple things we're working on for our next FREE investment template release is a neighborhood grading scale directly impacting the algorithms in areas of rental growth rate and resale value along with interest rate and term adjustment features. Please comment on any additional features you would like to see in future releases.
If property management is more than you want to take on don't hesitate to ask us to do all or a portion of your property management.


